Sensors
30 MHz built the ZENSIE dashboard with growers, to deliver accurate, real-time data how they need it. Deploy and manage sensors in minutes without tech support, and keep track of all your metrics in one central, easy to use platform that’s accessible on any device. Make the best decisions for your crops with interactive heatmaps, charts, custom calculations, alerts and shareable widgets.
Collaborative, interactive crop-level insights
What’s the ROI of data-driven agriculture? What are the benefits of real-time, remote monitoring for agribusinesses? How does a collaborative data platform help you have a better harvest?
We’ve helped growers, cold store managers, IPM consultants– agribusinesses across the chain make better decisions and keep track of knowledge around crop management.
Good ideas are worth sharing. We’ve seen growers within our community sharing experiences, sharing strategies and replicating each others’ successes. Some grow the same crops— but we’ve seen firsthand that growers don’t necessarily have to work in completely similar contexts to face similar challenges, or learn from one another.
Real-time monitoring, farm to fork gives growers the insights to make better decisions. From cultivation to harvest, packing, processing and shipping, agri- and horticulture faces challenges that can be avoided with environmental and crop-level data. Real-time monitoring with wireless sensor technology empowers agribusinesses to look back on their crops’ history and current status, quickly respond to prevent a range of risks including disease, rot and sunscald and take proactive measures to ensure the highest quality, best flavor and most efficient use of resources. Developed with input from leading growers, agri-data platform ZENSIE makes it easy for growers to deploy wireless sensors and start capture the metrics most crucial to their operations in minutes, without technical expertise.
Metrics that matter to growers
Capture the metrics you need to make a difference in your agribusiness. Our customers use crop-level data to drive yields, reduce losses, optimise irrigation, improve storage, prevent disease risk, and reduce energy. Know what your crops need by monitoring metrics including: VPD, dewpoint, moisture deficit, EC, VWC, temperature, light intensity, relative humidity and CO2.
Growing Degree Units
Growing degree days (GDD) are used to estimate heat accumulation and predict the development of plants and pests. An even more accurate measure is growing degree hours (GDH), where on an hourly basis the average temperature is used to calculate the growing degrees.
Growing degree days (GDD) are used to estimate heat accumulation and predict the development of plants and pests. An even more accurate measure is growing degree hours (GDH), where on an hourly basis the average temperature is used to calculate the growing degrees.
Social feed
Stay up to date on your colleague’s work, share knowledge and create an interactive record of your past crop strategy with a feed of comments and images.
Stay up to date on your colleague’s work, share knowledge and create an interactive record of your past crop strategy with a feed of comments and images.
Visual comments
Dive into your live and historical data to flag anomalies, keep notes, add pictures or ask questions of colleagues. Keep the dialogue in a central platform where data is easily shared and exported, but you’re the sole proprietor.
Dive into your live and historical data to flag anomalies, keep notes, add pictures or ask questions of colleagues. Keep the dialogue in a central platform where data is easily shared and exported, but you’re the sole proprietor.
Manual data input
With the manual input feature, we make it easy to bring data collected the low-tech way straight into the 30MHz data platform, and interact with that data alongside crop-level data, or data from a climate control system. And, as with all other data in the 30MHz platform, users can share, compare and collaborate with colleagues.
With the manual input feature, we make it easy to bring data collected the low-tech way straight into the 30MHz data platform, and interact with that data alongside crop-level data, or data from a climate control system. And, as with all other data in the 30MHz platform, users can share, compare and collaborate with colleagues.
Work more efficiently in groups
Groups are a new way to work together on specific projects monitoring and responding to crops’ needs. Invite team members within and outside your organisation, set permissions and choose the sensors you work with in this interactive workspace.
Groups are a new way to work together on specific projects monitoring and responding to crops’ needs. Invite team members within and outside your organisation, set permissions and choose the sensors you work with in this interactive workspace.
Gauge your sensor values
Meet gauges. An easy way to see your metrics relative to maximums and minimums. Choose your sensor, choose your metric, select a time period, set your max and mins, and get monitoring.
Meet gauges. An easy way to see your metrics relative to maximums and minimums. Choose your sensor, choose your metric, select a time period, set your max and mins, and get monitoring.
Visualise notifications in charts
So you’ve set your dynamic range notifications, now what? Map notification perimeters to your charts, so you can see when your crop levels have gone out of bounds.
So you’ve set your dynamic range notifications, now what? Map notification perimeters to your charts, so you can see when your crop levels have gone out of bounds.
A modern, powerful API
From data from climate control systems, to insights on root zone, irrigation or traceability, view granular crop-level measurements alongside the agri-data relevant to you.
From data from climate control systems, to insights on root zone, irrigation or traceability, view granular crop-level measurements alongside the agri-data relevant to you.
Image upload
Make sensor measurements tangible by plotting sensor values onto your choice of images. Visualize sensor readings on maps, diagrams, or photographs.
Make sensor measurements tangible by plotting sensor values onto your choice of images. Visualize sensor readings on maps, diagrams, or photographs.
Calculations
Get more out of your sensor measurements with calculations that deliver new metrics. Use the 30MHz data platform to calculate dew point, vapor pressure deficit, temperature hours, combined utilization and more.
Get more out of your sensor measurements with calculations that deliver new metrics. Use the 30MHz data platform to calculate dew point, vapor pressure deficit, temperature hours, combined utilization and more.
Share sensor insights
Selectively share sensory data with third parties. Dashboard social sharing lets individuals outside your organization (like partners, customers or advisors) observe changing conditions in your environment in real-time.
Selectively share sensory data with third parties. Dashboard social sharing lets individuals outside your organization (like partners, customers or advisors) observe changing conditions in your environment in real-time.
Heatmaps
Value heat maps generate live-animated, color-coded visualizations of the state of your crops, with a useful bird's eye view of changes.
Value heat maps generate live-animated, color-coded visualizations of the state of your crops, with a useful bird's eye view of changes.
Notifications
Set up custom notifications when sensor values cross certain thresholds, get alerts on uptime and connectivity, and stay up to date on each device’s battery life in real-time with alerts via email or sms.
Set up custom notifications when sensor values cross certain thresholds, get alerts on uptime and connectivity, and stay up to date on each device’s battery life in real-time with alerts via email or sms.
Charts
Track single sensor measurement values or compare metrics with easily customizable graphs and visualizations. Drill down by time frame, location and measurement frequency, and compare locations on a global scale.
Track single sensor measurement values or compare metrics with easily customizable graphs and visualizations. Drill down by time frame, location and measurement frequency, and compare locations on a global scale.
Zoom in on your data
Simply click into your chart, click on the starting point you want to zoom into, hold down your mouse, and drag to your desired end point. Let go, and you'll be forwarded to the zoomed view of your data.
Simply click into your chart, click on the starting point you want to zoom into, hold down your mouse, and drag to your desired end point. Let go, and you'll be forwarded to the zoomed view of your data.
Export data
Data is a valuable asset, and we make sure you have full control over who accesses it. Customers are sole proprietors of their sensor data, and can easily download it in CSV.
Data is a valuable asset, and we make sure you have full control over who accesses it. Customers are sole proprietors of their sensor data, and can easily download it in CSV.
Compare locations
Track environments across the globe in a single dashboard. Create custom reports and visualizations based on location, or set one space as a benchmark for comparison.
Track environments across the globe in a single dashboard. Create custom reports and visualizations based on location, or set one space as a benchmark for comparison.
Customise your branding
Upload logos, change colours, adjust the look and feel of your dashboards and groups and create pre-set themes for yourself, your team members or your customers.
Upload logos, change colours, adjust the look and feel of your dashboards and groups and create pre-set themes for yourself, your team members or your customers.
Setting up bar charts
Next to the usual graphs we've also given you the option to create bar charts in three different ways: single value charts, multiple sensor data points in one chart, or combine different values.
Next to the usual graphs we've also given you the option to create bar charts in three different ways: single value charts, multiple sensor data points in one chart, or combine different values.
Sensors
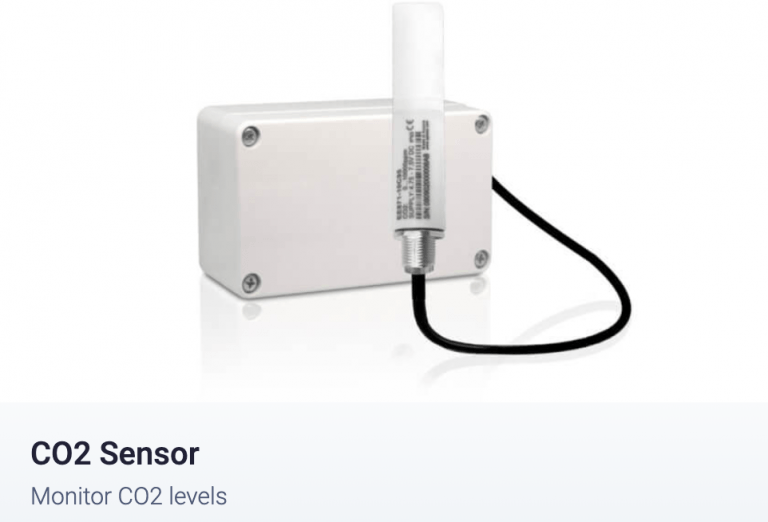
CO2 Sensor
Stay up to date on your crops’ needs by monitoring CO2 levels in real-time with this wireless carbon dioxide sensor. There a three variations of the sensor available. Each one measures a different range of ppm: 0-2.000 / 0-5.000 / 0-10.000 ppm. Deploy in moments without coding or technical assistance, and start capturing data in the ZENSIE dashboard. Generate graphs, visualizations, heatmaps and custom alerts straight to your mobile, tablet or computer.
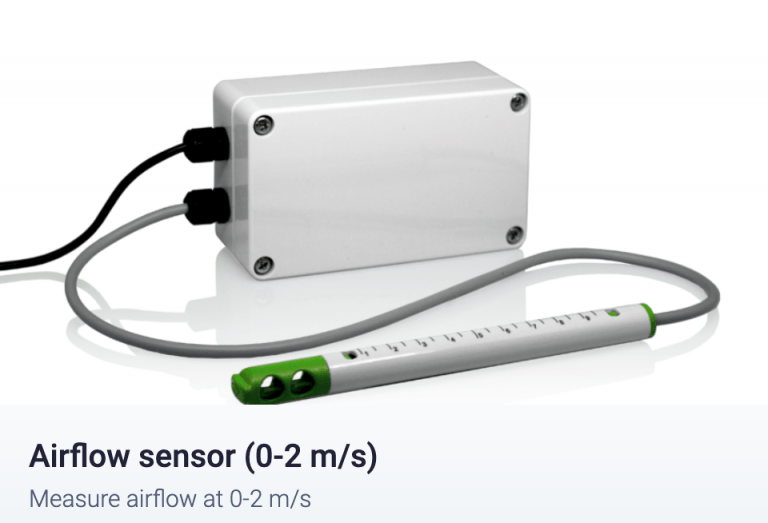
Airflow Sensor
Developed for the needs of commercial farmers, this rugged, watertight and easy to mount anemometer captures sensory data on subtle changes in airflow at 0-2 meters per second. Use real-time airspeed data captured in the ZENSIE dashboard to monitor storage, drying and processing, as well as manufacturing conditions.
Humidity Sensor
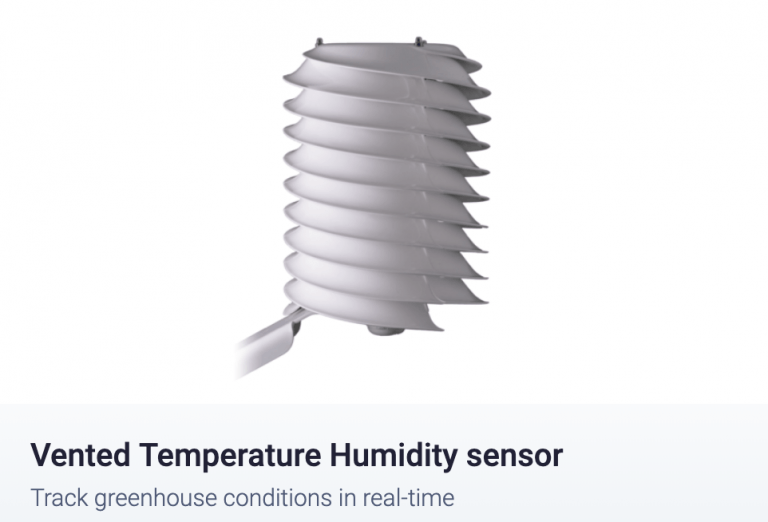
Developed for the needs of commercial farmers, the temperature humidity sensor is designed to provide real-time granular data on environmental conditions from any location, whether it’s the furthest corner of a greenhouse or a field full of crops. Set your parameters in the ZENSIE dashboard, and get alerts as soon as temperature or humidity rises or falls beyond your defined thresholds.
The temperature humidity sensor is wireless and watertight, for reliable measurements in any environment. Use this sensor alongside the pointed temperature sensor to determine the dewpoint of individual plants.
Substrate Sensor
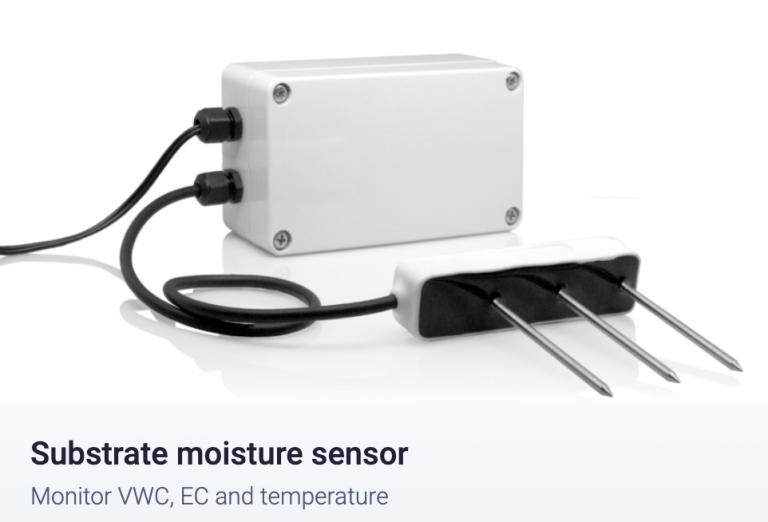
This sensor was designed to measure the water content, electrical conductivity, and temperature of many types of growing media, primarily in greenhouse applications where the slim, stainless steel needles could be inserted easily into a variety of substrates.
Using real-time data from soil sensors, farmers can adjust and tailor a granular approach to irrigation and nutrient delivery. Custom alerts can provide insights on which crops are in need of irrigation, and which are in need of drainage to prevent the damaging effects of overwatering including standing water compromising root development, overaccumulation of salts, root rot, fungus and mildew.
Pointed Temperature Sensor
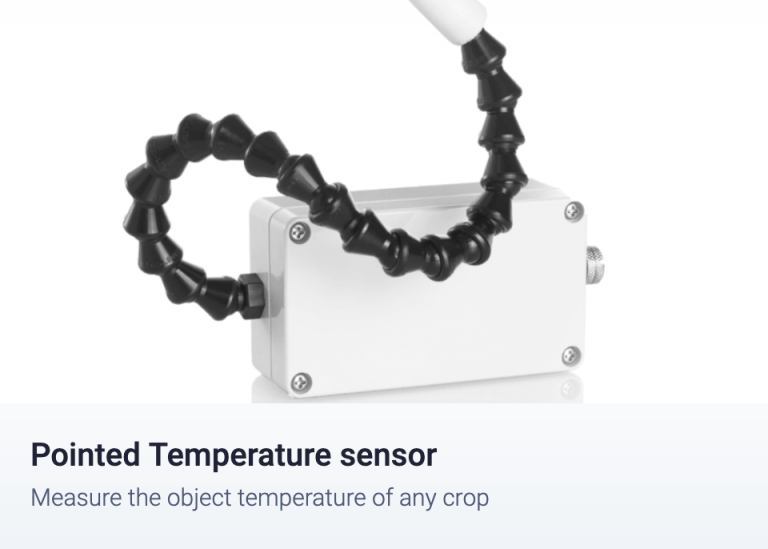
Developed with Dutch commercial pepper farmers to capture the skin temperature of individual plants, the pointed infrared temperature sensor is built to flexibly position around objects of any shape and measure surface temperature without contact.
Use the pointed temperature sensor alongside our temperature humidity sensor to determine the dewpoint of individual plants.

Contact Us:
18 North 57th Drive Ste #1
Phoenix, Az 85043
(844) 388-2434
info@dutchdirect.us
© Copyright 2024 Dutch Direct LLC.
About Dutch Direct
We offer direct access to exclusive and quality brands at highly competitive price-points. We also offer solutions on consumables and equipment at a wholesale cost. Buy direct and save.

